Prepare Data for Delivery
If you followed the previous sections, you processed your point cloud in a specific processing-oriented tiling scheme (TILESCHEME_PROCESSING). This tiling scheme may or may not be how you want to store the output data permanently or deliver the data to your customer. For this reason, we here show how you can re-tile your output data by using a dedicated script for data delivery, which re-tiles your processed data into a different scheme. The applied re-tiling is the following:
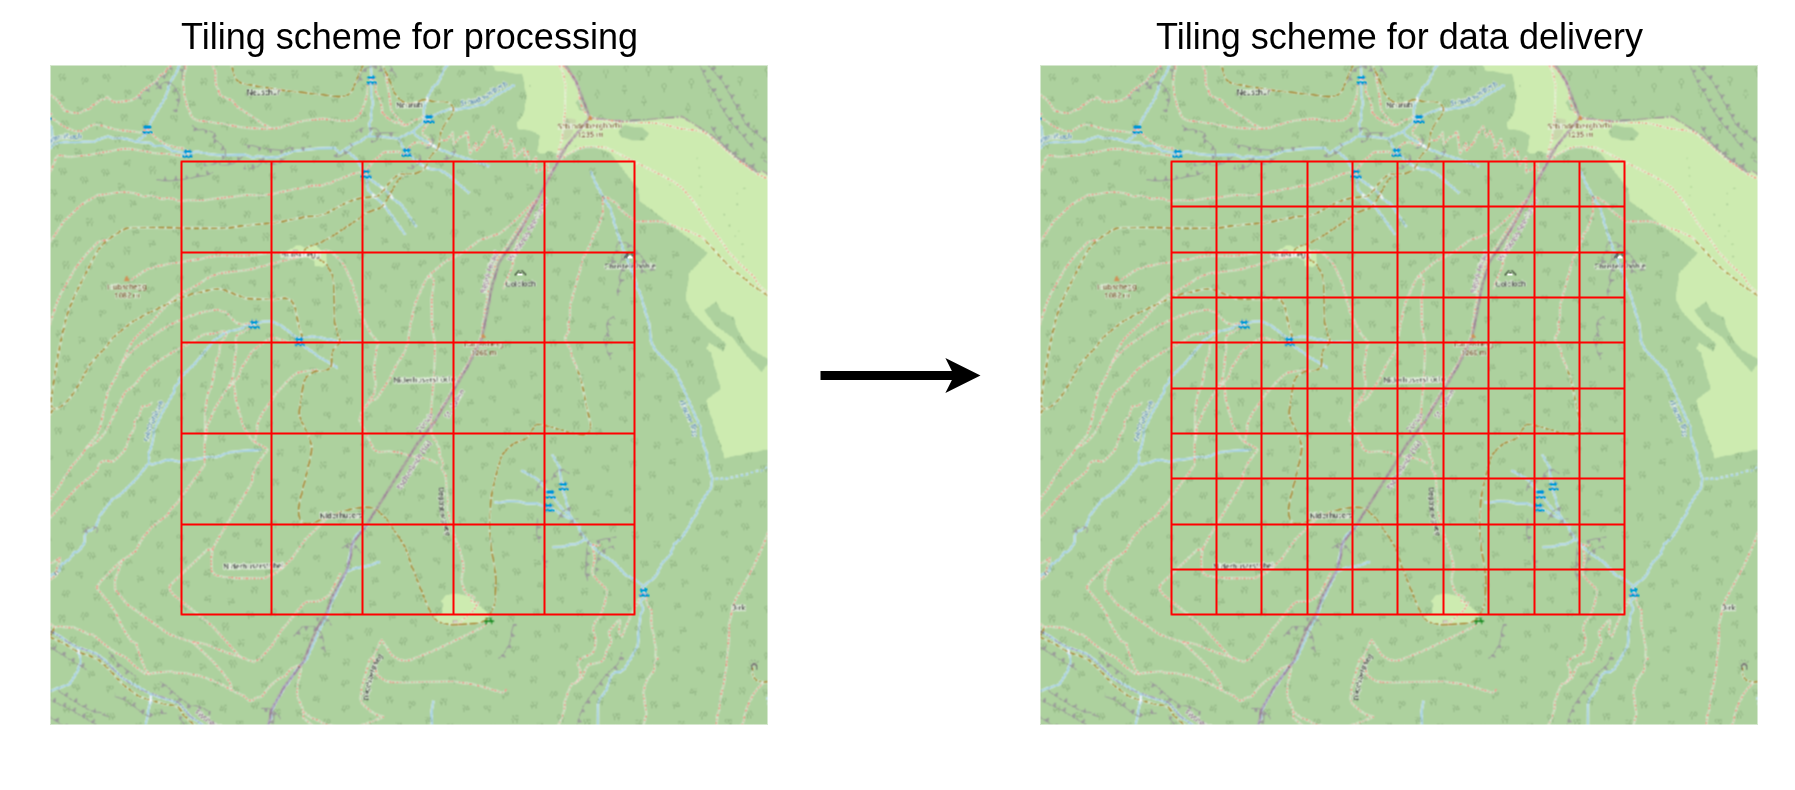
In this example, we choose a finer tile scheme (100 m tile size) for the final dataset. Please note that you can choose an arbitrary size for the tiles that fits your needs, e.g., you could also merge the output into a single output grid. After running the example here, feel free to play around with different sizes!
Here, the output data are raster datasets (grids). However, the same principles also apply when the output consists of point clouds, for example when processing data tile by tile. In such cases, you can still construct a virtual point cloud from the generated output files and subsequently re-tile or merge the resulting dataset.
Since the output data are now available as individual grids, tiled according to PROCESSING_UNITS, the workflow consists of the following steps:
- Create two virtual raster datasets
cfg.GRID_VRT_DSMandcfg.GRID_VRT_DTM(this is similar to the virtual las point cloud *.lasvf)
The virtual raster allows to treat the set of grid tiles as one single dataset. The user does not have to take care of any tile borders and can treat the dataset as just one. The concept also applies to country-wide datasets with thousands of tiles.
- Define tiling scheme for data delivery named
DELIVERY_UNITSinproject_config.py - Extract and save data according to this scheme
Fill the data_delivery.py Script
import os
import project_config as cfg
from PySAGA import saga_api, lis_cmd
from PySAGA.tools import *


def re_tile(unit_index):
    # -----------------------------------------------------------------------------
    # load the shapefile with the tiling scheme used for data delivery
    processing_units = saga_api.SG_Get_Data_Manager().Add_Shapes(
        cfg.DELIVERY_UNITS
    )

    if not processing_units:
        lis_cmd.Error_Exit(
            f"Loading processing_units {cfg.DELIVERY_UNITS} failed",
            starttime,
            True,
        )

    # -----------------------------------------------------------------------------
    # get extent to write
    proc_unit = processing_units.Get_Shape(unit_index)

    xmin = proc_unit.Get_Extent().Get_XMin()
    ymin = proc_unit.Get_Extent().Get_YMin()
    xmax = proc_unit.Get_Extent().Get_XMax()
    ymax = proc_unit.Get_Extent().Get_YMax()

    # units are referenced by their lower-left corner coordinate
    unit_name = f"{int(xmin)}_{int(ymin)}"

    lis_cmd.Message_Print(f"Writing processing unit {unit_name}\n")

    # --------------------------------------------------------------
    # will become filled with grids after successful execution with output data
    grids_dsm = []

    if not io_gdal.Import_Raster(
        GRIDS=grids_dsm,
        INPUT="Files",
        FILES=cfg.GRID_VRT_DSM,
        MULTIPLE="automatic",
        TRANSFORM=True,
        RESAMPLING="Nearest Neighbour",
        EXTENT="user defined",
        EXTENT_XMIN=xmin,
        EXTENT_XMAX=xmax,
        EXTENT_YMIN=ymin,
        EXTENT_YMAX=ymax,
    ):
        return lis_cmd.Error_Return(
            f"Failed to retrive grid from vrt for processing unit {unit_name}"
        )

    dsm = saga_api.SG_Get_Data_Manager().Add(grids_dsm[0]).asGrid()
    # now we write a GeoTIFF (*.tif) for every unit!
    dsm.Save(
        os.path.join(cfg.GRIDS_DIR_DELIVERY, "dsm_" + unit_name + ".tif")
    )

    # will become filled with grids after successful execution with output data
    grids_dtm = []

    if not io_gdal.Import_Raster(
        GRIDS=grids_dtm,
        INPUT="Files",
        FILES=cfg.GRID_VRT_DTM,
        MULTIPLE="automatic",
        TRANSFORM=True,
        RESAMPLING="Nearest Neighbour",
        EXTENT="user defined",
        EXTENT_XMIN=xmin,
        EXTENT_XMAX=xmax,
        EXTENT_YMIN=ymin,
        EXTENT_YMAX=ymax,
    ):
        return lis_cmd.Error_Return(
            f"Failed to retrive grid from vrt for processing unit {unit_name}"
        )

    dtm = saga_api.SG_Get_Data_Manager().Add(grids_dtm[0]).asGrid()
    # now we write a GeoTIFF (*.tif) for every unit!
    dtm.Save(
        os.path.join(cfg.GRIDS_DIR_DELIVERY, "dtm_" + unit_name + ".tif")
    )

    return True


# the main function
if __name__ == "__main__":
    # -----------------------------------------------------------------------------
    # start the logging
    starttime = lis_cmd.Start_Logging(False)

    # -----------------------------------------------------------------------------
    # retrieve list of all output grids
    inputfiles_dsm = lis_cmd.Create_File_List(
        cfg.DSM_DIR,
        ".tif",
        os.path.join(cfg.DSM_DIR, "output_file_list.txt"),
    )

    # -----------------------------------------------------------------------------
    # create catalog of those files
    if not io_gdal.Create_Virtual_Raster_VRT(
        FILE_LIST=inputfiles_dsm, VRT_NAME=cfg.GRID_VRT_DSM
    ):
        lis_cmd.Error_Exit(
            f"Failed to create virtual raster {cfg.GRID_VRT_DSM}",
            starttime,
            True,
        )

    # now for the DTM
    inputfiles_dtm = lis_cmd.Create_File_List(
        cfg.DTM_DIR,
        ".tif",
        os.path.join(cfg.DTM_DIR, "output_file_list.txt"),
    )

    # -----------------------------------------------------------------------------
    # create catalog of those files
    if not io_gdal.Create_Virtual_Raster_VRT(
        FILE_LIST=inputfiles_dtm, VRT_NAME=cfg.GRID_VRT_DTM
    ):
        lis_cmd.Error_Exit(
            f"Failed to create virtual raster {cfg.GRID_VRT_DTM}",
            starttime,
            True,
        )

    # -----------------------------------------------------------------------------
    # load the shapefile with the tiling scheme used for data delivery
    processing_units = saga_api.SG_Get_Data_Manager().Add_Shapes(
        cfg.DELIVERY_UNITS
    )

    if not processing_units:
        lis_cmd.Error_Exit(
            f"Loading processing_units {cfg.DELIVERY_UNITS} failed",
            starttime,
            True,
        )

    # -----------------------------------------------------------------------------
    # iterate over the processing units and process each unit by calling the task function
    # (this loop, of course, could also be parallelized!)
    for unit_index in range(processing_units.Get_Count()):
        result = re_tile(unit_index)

        if not result:
            lis_cmd.Error_Exit("Processing task failed", starttime)

    # -----------------------------------------------------------------------------
    # free memory and stop logging
    saga_api.SG_Get_Data_Manager().Delete()

lis_cmd.Stop_Logging(starttime)Now, run the entire processing chain with a single command by typing:
python run_script.py data_preparation.py data_processing.py data_delivery.py