Geology
Structural geology investigates the three-dimensional arrangement and deformation of rock masses. Accurate measurement of rock geometries is fundamental for understanding geological structures and assessing their engineering significance.
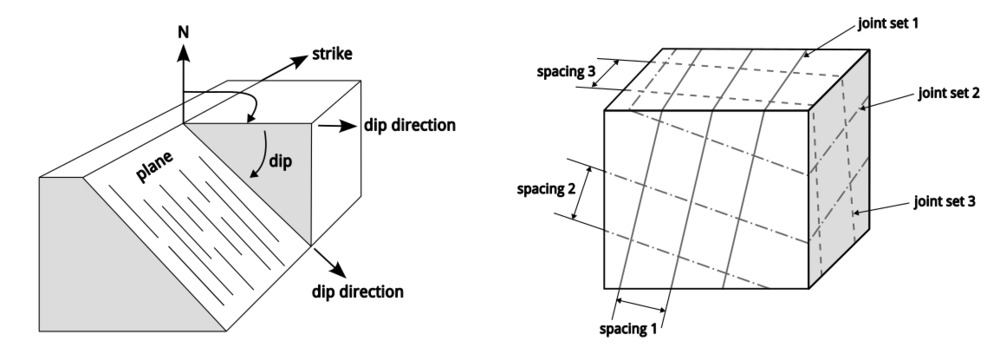
Rock slope stability is largely controlled by the distribution and characteristics of structural discontinuities, such as joints, bedding planes, and faults. These discontinuities are surfaces of weakness that interrupt the continuity of the rock mass and can significantly reduce its overall strength.
The orientation of discontinuities relative to a slope or engineered excavation plays a critical role in determining whether unstable conditions may develop and which failure mechanisms are likely to occur. Furthermore, the spacing and orientation of discontinuity sets govern the size and shape of rock blocks, making their accurate characterization essential for geotechnical and engineering geological assessments.
Joint orientation and spacing are key parameters for rock mass characterization, engineering design, and natural hazard assessment. Advances in terrestrial laser scanning (TLS) and point cloud processing now make it possible to extract these parameters automatically using specialized analysis tools. Compared with traditional field mapping, this approach provides a far greater number of measurements, improves statistical reliability, and allows the investigation of inaccessible rock faces. LIS Pro 3D offers a comprehensive set of tools within its geology package for the detection, characterization, and analysis of discontinuities directly from TLS point cloud data.
To reliably determine the orientations of all discontinuities within a rock face, scanning must be performed from multiple positions and viewing directions to minimize occlusions and scan shadows. After point cloud registration, the typical processing workflow consists of the following steps:
1. Data Homogenization
Because the rock face is scanned from several positions, point density often varies across the dataset. In areas where scans overlap, the point cloud is typically oversampled. Data homogenization is therefore performed to achieve a spatially uniform point density, ensuring consistent results in subsequent analyses.
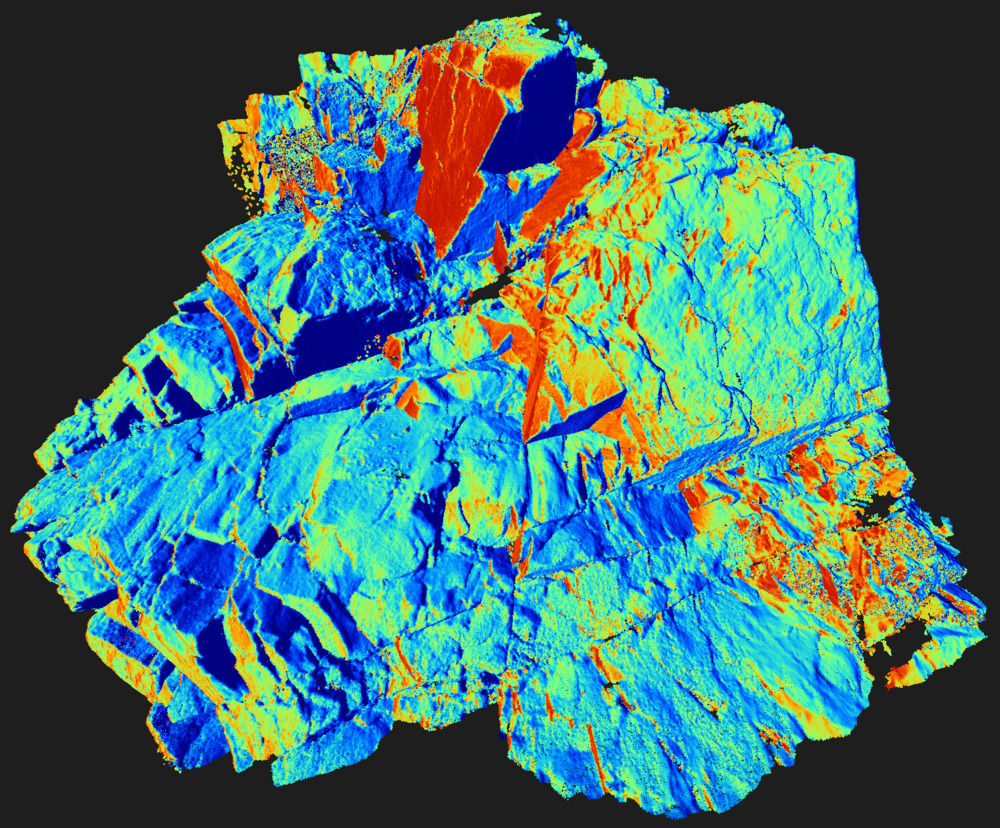
2. Normal Vector Calculation
Surface normal vectors describe the local orientation of a surface and are calculated for each point in the cloud. Since the objective is to characterize planar discontinuity surfaces, it is essential that sharp edges and boundaries between discontinuities are preserved. This requires a robust normal vector estimation algorithm; otherwise, normal vectors may become distorted across edges between discontinuities, reducing the accuracy of orientation measurements.
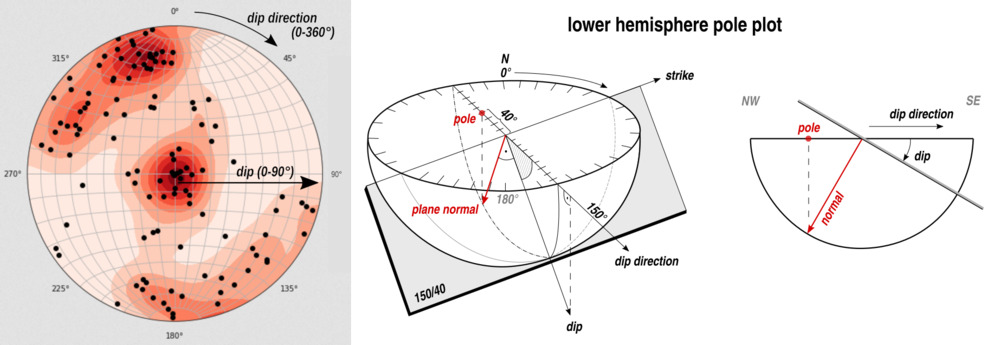
3. Density Plot Generation
To visualize and analyze the dominant orientations within the rock face, the calculated normal vectors are projected onto a lower-hemisphere pole plot. This stereographic representation displays the dip and dip direction of surface elements together with their frequency of occurrence. Because it illustrates the concentration of orientations, it is commonly referred to as a density plot.
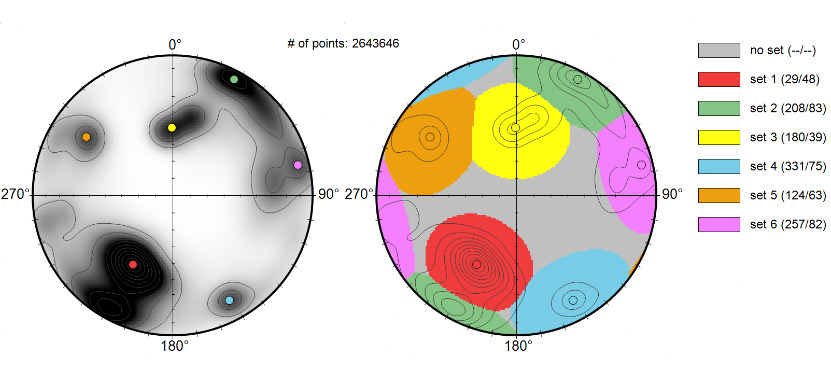
4. Identification of Discontinuity Sets
The orientation density distribution shown in the pole plot is used to cluster similar orientations into discontinuity sets, representing the principal joint or fracture systems within the rock mass. Each discontinuity set is characterized by its representative dip and dip direction.
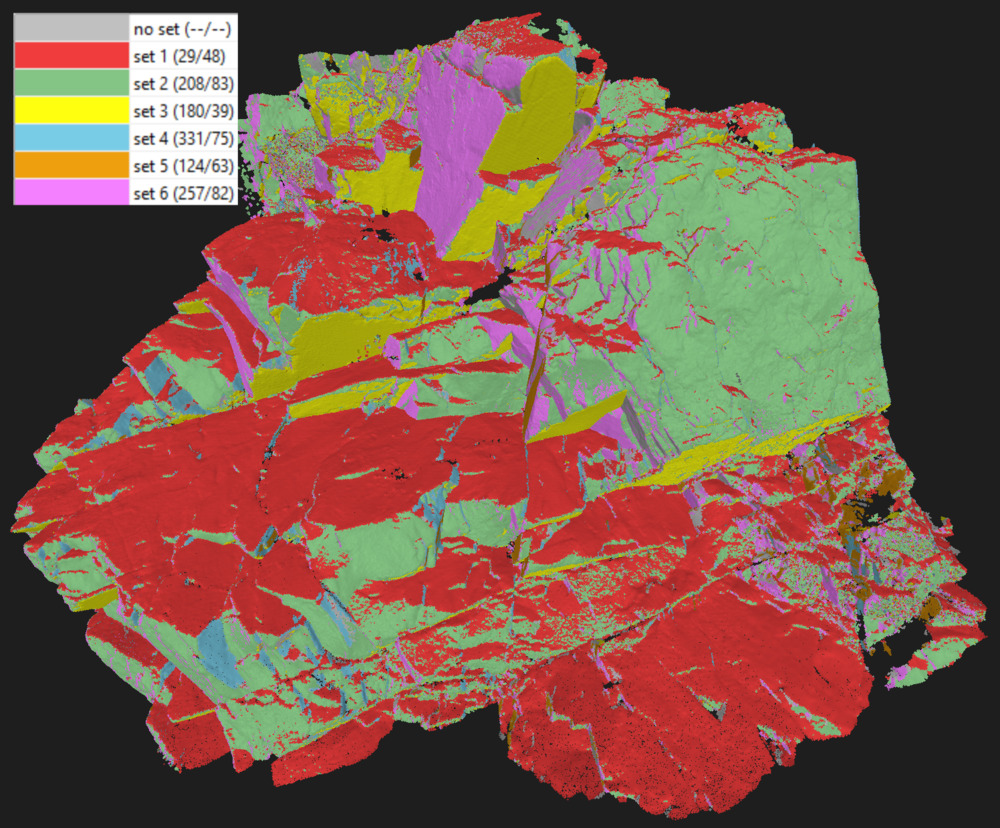
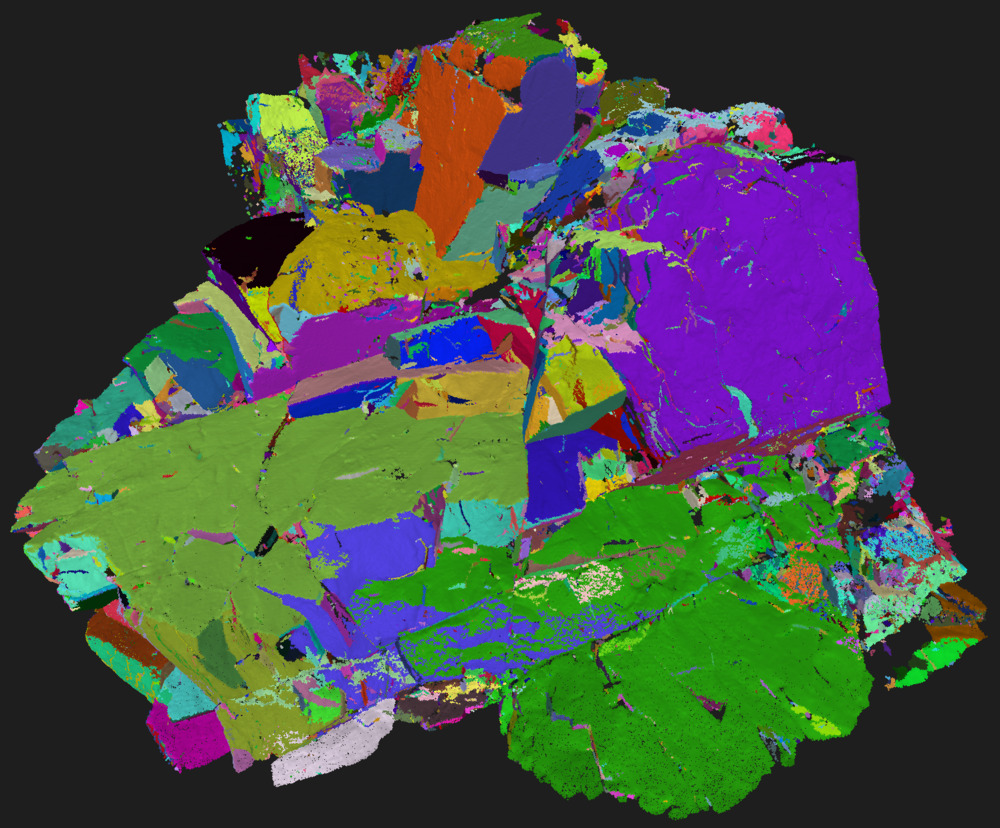
5. Clustering of Joint Planes
The identified discontinuity sets are then used to segment the point cloud into individual joint planes. Unlike the normal vector calculation step, where a normal vector is assigned to every point, this process groups points belonging to the same planar discontinuity and assigns a single representative orientation to each detected joint plane.
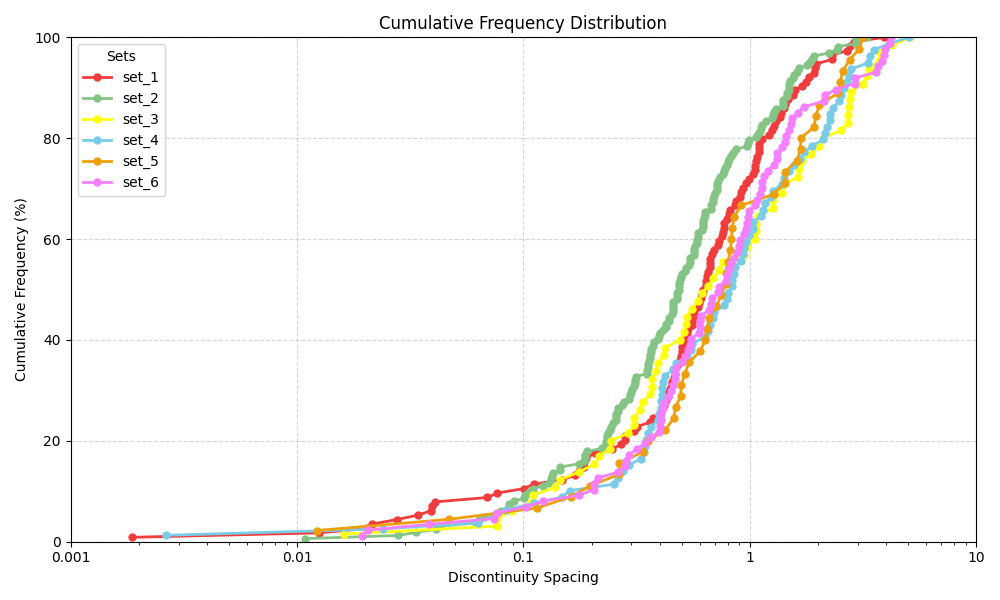
6. Discontinuity Spacing Analysis
Finally, the spacing of joint planes within each discontinuity set is analyzed, producing a frequency distribution of discontinuity spacing for each set. Combined with discontinuity orientation, this information can be used to estimate potential block sizes in quarry operations and to support rockfall and natural hazard runout modelling. Furthermore, the orientation of discontinuities relative to the overall rock slope geometry provides valuable information for assessing slope stability and identifying potential failure mechanisms.
Start Learning Today
Explore the structural geology tutorial and see how easy it is to relevant parameters from your point cloud data.
- Request your free LIS Pro 3D trial here
- Get started with our tutorial on Structural Geology