Getting Started with the SAGA & LIS Pro 3D GUI
What You Find in This Section
Here, we will describe the SAGA GUI in detail, with a dedicated explanation for each of the windows.
- Most important GUI elements
- Purpose of each window
- Context dependency
- Adding and removing windows
- Running tools
- Executing tools in the GUI
- Types of tool parameters
- Creating vs. overwriting datasets during tool execution
- Interactive tools
- Finding tools in the GUI
- How to load missing libraries
- Tool dialog
- Text search for tools
We will shortly outline the most important things that you need to know to get started with SAGA GIS. This will also help you to leverage the full power of LIS Pro 3D. Please note that this is not an introductory GIS tutorial and hence assumes that you have a fundamental understanding of how a GIS works. We here try to summarize the most important bits about SAGA GIS that help you get started when transitioning from some other GIS software.
Mastering the GUI of SAGA GIS
Most Important Windows in SAGA GIS
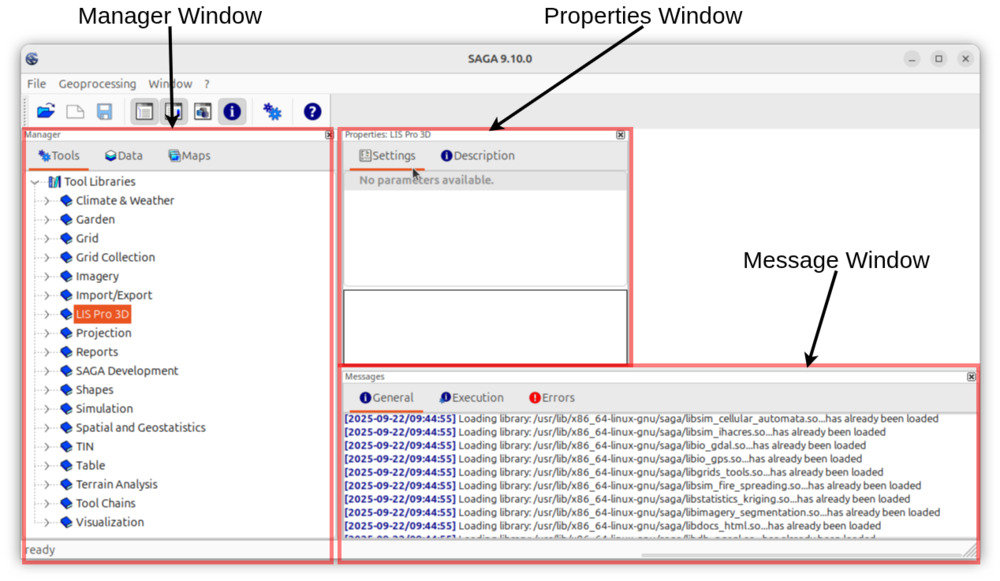
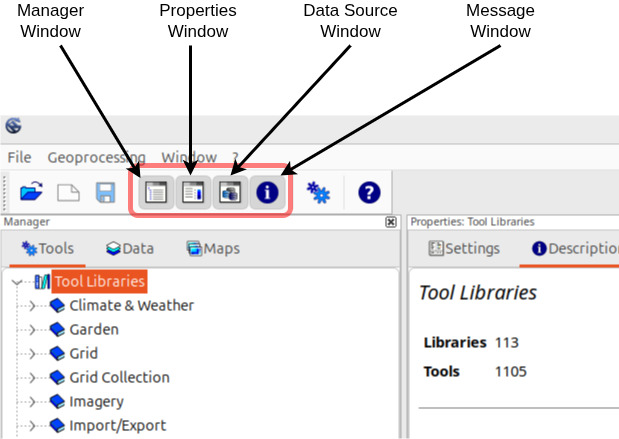
The most important elements in the SAGA GIS GUI are the following windows:
What is the Purpose of the Specific Windows?
| Window | Use-case |
|---|---|
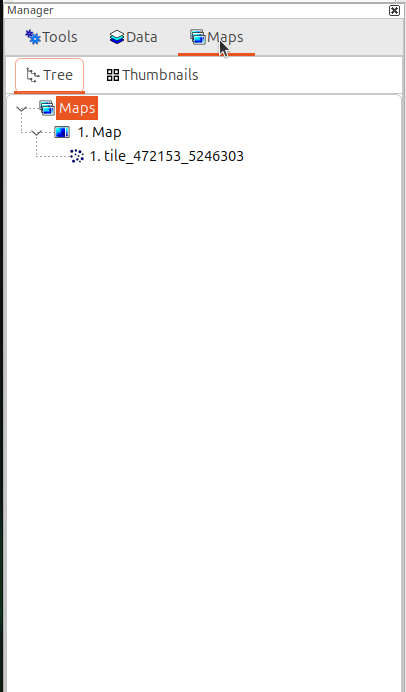
| Manager window | Via the tabs on top, it allows access to all tools, loaded data and maps. Right clicking objects in the manager window opens a context-dependent menu that exposes functionality that is typically used with this object. |
| Message window | Displays messages about successful or failed operations (e.g., when running tools, loading tools or anything else). |
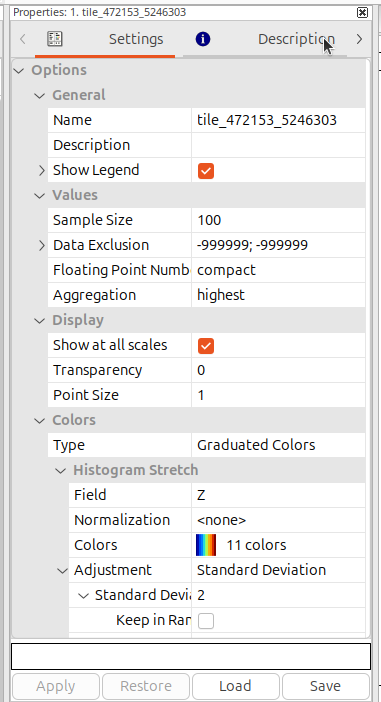
| Properties window | Like many parts of the SAGA GUI, this window is context dependent. If you select a tool in the Manager Window, the tool parameters and description will show here. Likewise, if you select a data source in the Manager Window, the details of that data source will show in this window. If you click on a map in the Manager Window, you can see the settings of that map here. |
Context Dependency of Windows
The Properties window is context-dependent: whatever is selected in the Manager window determines what is displayed in the Properties window.
| Manager window | Properties window |
|---|---|
 |
 |
 |
 |
 |
 |
Adding and Removing Windows
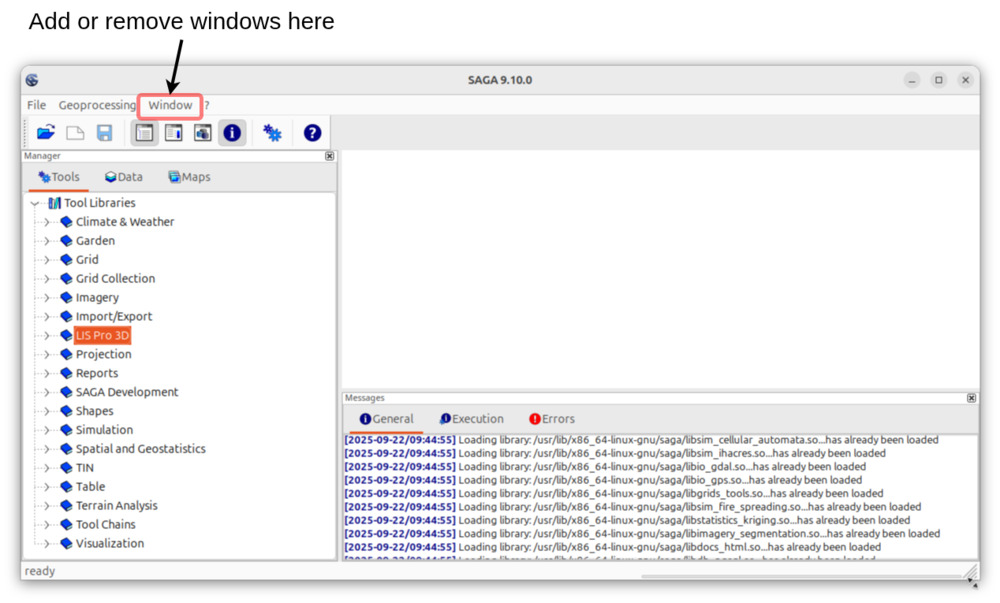
Whenever you are missing a specific window (e.g., because you accidentally closed it, or it is not there after opening SAGA GIS), click on the respective button in the toolbar or use the “Window” menu and select the missing window. This will open the window again.
Option 1: Use Toolbar Buttons
Option 2: “Window” Menu
Running Tools
Executing Tools in the GUI
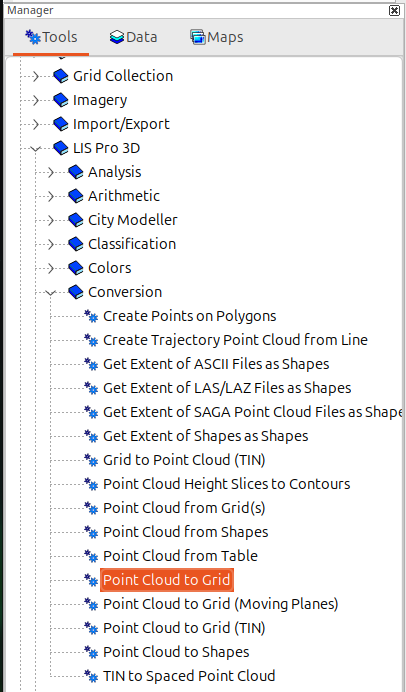
The first step is to open the tool interface. See Section 2.4 for different options on how to find a tool. Let’s take the Point Cloud to Grid tool as an example:
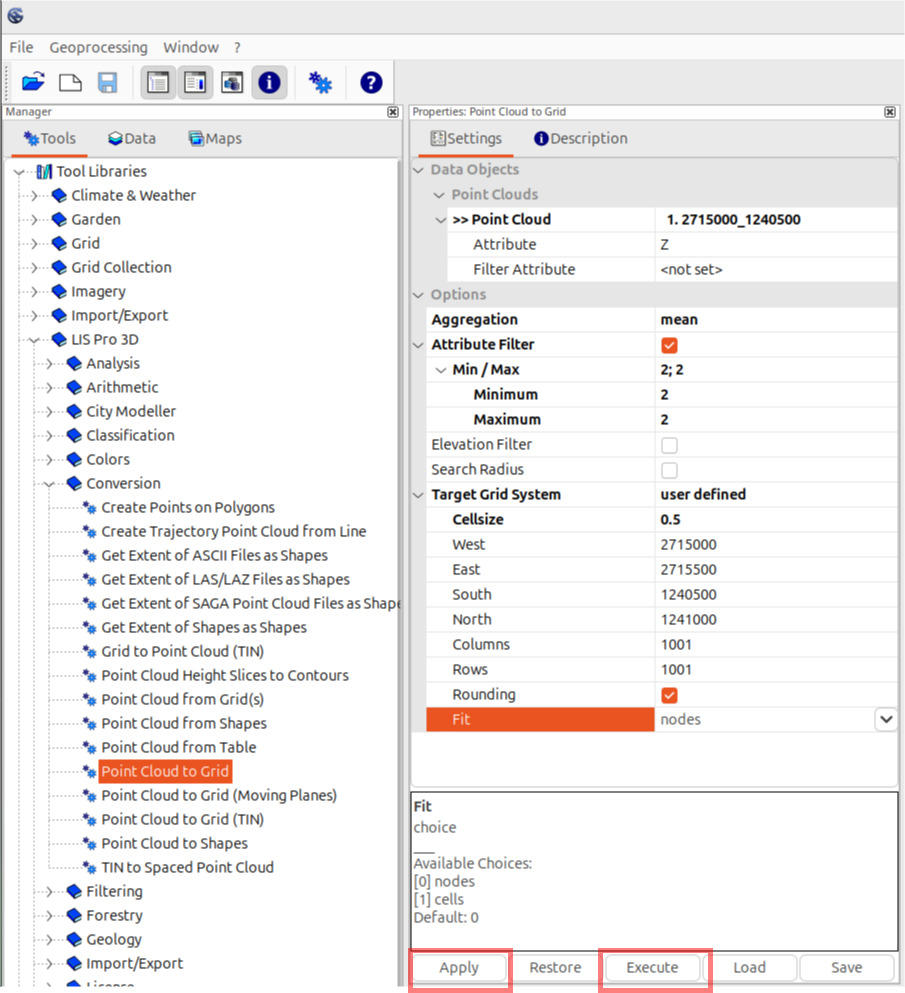
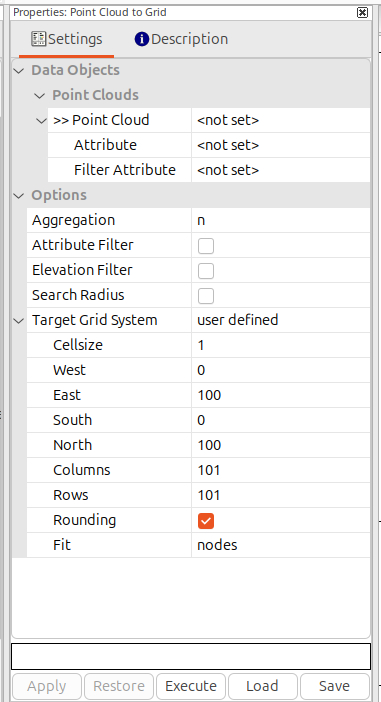
The second step is to set all parameters that are required by the tool. Once you are done filling these parameters, you can click the Apply button. This will apply your settings and save them in case you switch to another Properties window.
The last step is to start the tool execution by clicking the Execute button. Note: if you directly start the tool after setting the parameters, applying the parameters is not required.
Saving Tool Parameters Permanently
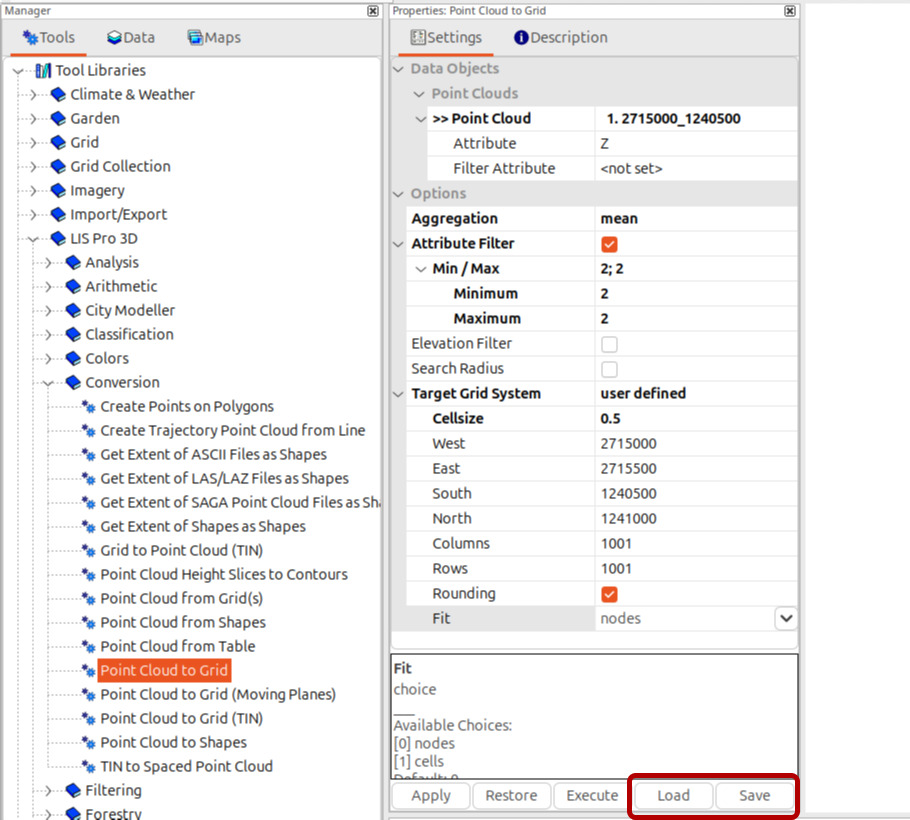
You can permanently save tool parameters via the Save button and load them at a later stage via the Load button. This allows to re-apply the same parameters again at a later stage. Note that input datasets must be stored to disk before saving the parameter settings in order to be able to restore their settings on load.
How We Represent Tool Interfaces in Our Tutorials
To provide a cleaner visual representation of tool parameters in our tutorials, we represent the interface of a tool in a compact representation that includes
- The Tool name, e.g. Tool: Point Cloud to Grid
- Where to find the tool in the Geoprocessing menu or the Tools tab, e.g.
- Geoprocessing → LIS Pro 3D → Conversion → From Point Cloud
- Tools → LIS Pro 3D → Conversion
- The parameter interface settings (everything listed in the table)
So most of the time, we will not provide a screenshot of the tool’s parameter settings but use this representation. This enables you to easily locate the tool in the way you prefer - either in the Tools tab of the Manager window or via the Geoprocessing menu (see Section 2.4 for a description on how to find tools). For the Point Cloud to Grid tool, this tabular representation looks as follows:
Tool: Point Cloud to Grid
Geoprocessing → LIS Pro 3D → Conversion → From Point Cloud // Tools → LIS Pro 3D → Conversion
| Parameter | Setting |
|---|---|
| Data Objects | |
| Point Clouds | |
| >> Point Cloud | <not set> |
| Attribute | <no set> |
| Filter Attribute | <no set> |
| Options | |
| Aggregation | n |
| Attribute Filter | ☐ |
| Elevation Filter | ☐ |
| Search Radius | ☐ |
| Target Grid System | user defined |
| Cellsize | 1 |
| West | 0 |
| East | 100 |
| South | 0 |
| North | 100 |
| Columns | 101 |
| Rows | 101 |
| Rounding | 🗹 |
| Fit | nodes |
Dataset Parameters
Generally, most tools require
- Input dataset(s)
- Output dataset(s)
Both of these can be either
- mandatory
- or optional
Mandatory inputs are represented by two greater-than signs >> pointing to the right. Likewise, mandatory outputs are represented by two smaller-than signs << pointing to the left.
Optional inputs are represented by a single greater-than sign > pointing to the right. Likewise, Optional outputs are represented by a single smaller-than sign < pointing to the left.
This visual cue allows you to quickly identify the requirements of a specific tool. Take our Tree Shape Metrics 3D tool as an example that uses all types of input and output datasets:
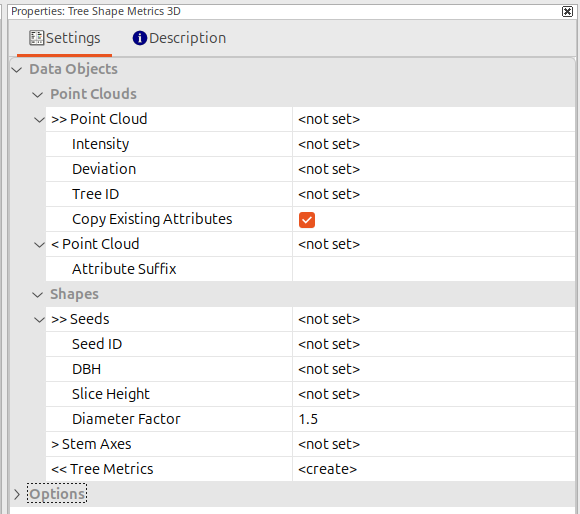
Datasets with Attributes
Data types such as tables, shape layers, or point clouds have attributes that can be used for computations. To specify these in a tool, you must first provide the input dataset. The tool then evaluates which attribute fields are available in the dataset and allows you to select them using the table field parameters shown below the dataset (e.g., the “Intensity” point cloud attribute in the screenshot above).
Other Tool Parameters
Besides dataset parameters, tools provide parameters to control their functionality. This includes text fields and checkboxes, values and value ranges, as well as choice lists.
Creating New Datasets vs. Overwriting Existing Datasets on Tool Execution
Not all SAGA GIS and LIS Pro 3D tools create new datasets to store results. Many tools allow you to operate directly on the input dataset rather than creating a copy. This applies both to tools running in the GUI and to LIS Pro 3D scripting with Python. A typical example is point cloud segmentation. In this case, the (unsegmented) input point cloud receives a new attribute field during the segmentation process, which stores the segment identifier for each point, rather than creating a full copy of the point cloud. This approach reduces memory usage by avoiding data duplication.
Many tools in the GUI allow two or three different choices for output dataset(s):
<not set>: this will operate on the input dataset (e.g., write the tool output as a new attribute field)<create>: this will create a new output dataset that contains the tool output- a list of one or more existing datasets: this choice will overwrite the existing dataset - please note, that the output dataset specified in this case must not be an input dataset to the very same tool call, as SAGA GIS & LIS Pro 3D do not allow you to overwrite input datasets.
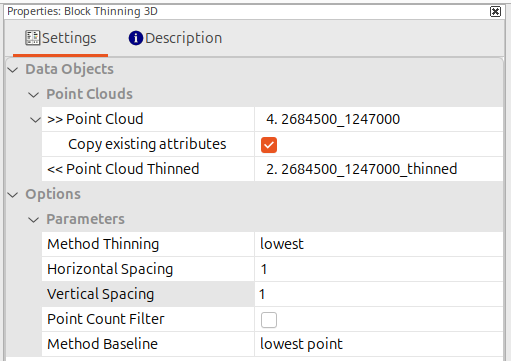
As described above, output datasets can be set to create new datasets AND to existing datasets for overwriting these existing ones. This means you can re-run the same tool again and define the previous output as the target dataset. This is a nice option if you want to change the parameters of a tool call repeatedly without creating new output datasets each time. Consider the example in which we call the Block Thinning 3D tool twice with different parameter sets:
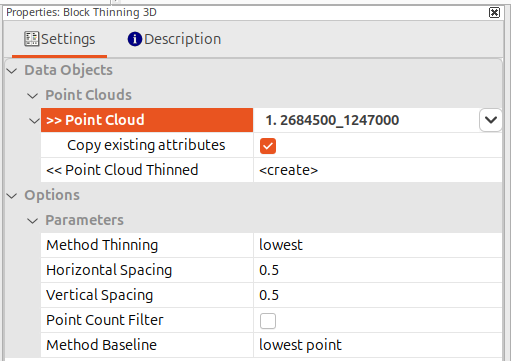
1. The initial tool call creates the output dataset
Note how the << Point Cloud Thinned parameter (the output dataset) is set to <create>. This means, a new thinned out point cloud will be created by the tool. The output will be named “2684500_1247000_thinned”.
2. Subsequent tool calls can overwrite the output from the initial tool call
Note how the << Point Cloud Thinned parameter is now set to 2684500_1247000_thinned (the output from the previous step). Calling the tool like this means that the output dataset from the previous step will be overwritten with the output from the subsequent tool call.
Special Cases: Replacing the Input Dataset with the Output
Some tools provide the option to replace the input dataset with the output. In this case, the output dataset is optional, and if the user chooses not to set it to <create>, the input dataset will be replaced by the result. One example is the Close Gaps tool, which fills data gaps in the input raster. Instead of creating a copy of the input dataset without gaps, the input dataset can be overwritten.
Another example is that many point cloud tools allow the computed attributes to be attached directly to the input point cloud instead of creating a new point cloud containing the results. Since point clouds usually require a large amount of RAM, this is a convenient option when processing a point cloud in several steps.
Interactive Tools
Generally, there are two modes to execute tools in the GUI within SAGA GIS & LIS Pro 3D: regular and interactive. The regular mode only requires the user to set the tool parameters and start the tool execution. As the name implies, the interactive mode allows the user to interactivaly set tool parameters, such defining a 2D bounding box by drawing on the screen rather than supplying a polygon shapes layer with said bounding box.
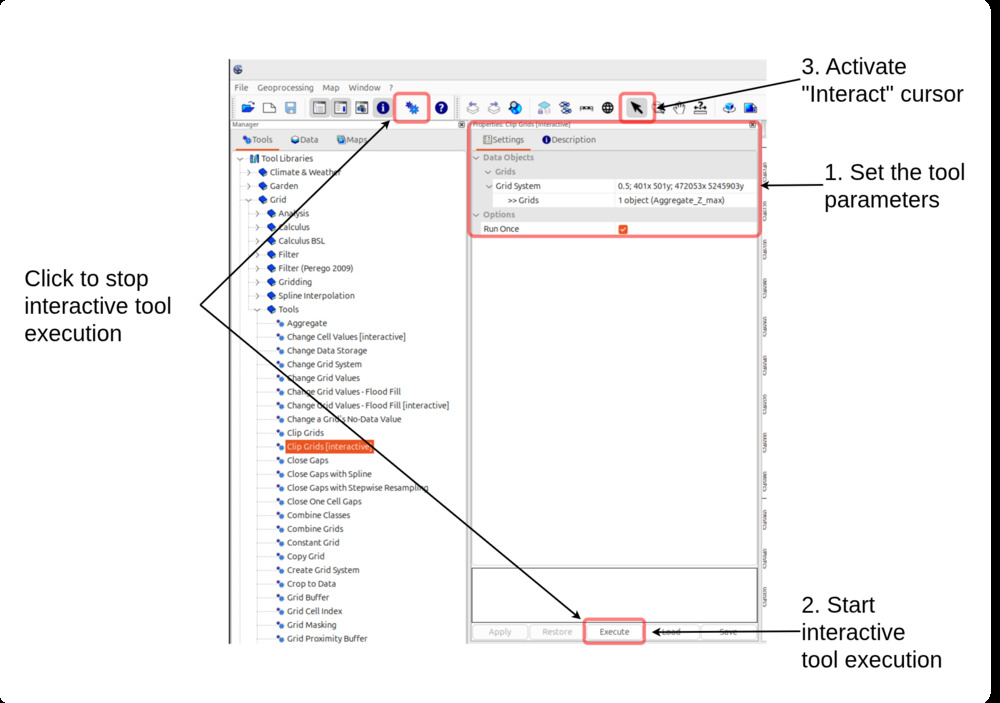
All interactive tools adhere to the same workflow:
- Set the required tool parameters
- Start the interactive tool by clicking the “Execute” button
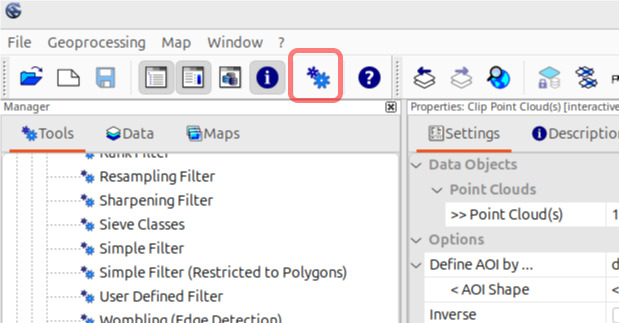
- (If not already active) select the “Interact” tool (button with the black mouse cursor in the toolbar)
Now, either
- Perform the interactive operation in a map view
- Or stop the tool execution without any action by either clicking the “Execute” button again or the “Run Tool” button in the toolbar
A classic example for an interactive tool is SAGA’s Grid > Tools > Clip Grids [interactive] tool, which let’s the user draw a rectangular bounding box to clip a raster layer:
Finding Tools in the GUI
The GUI provides three ways to find and run a tool:
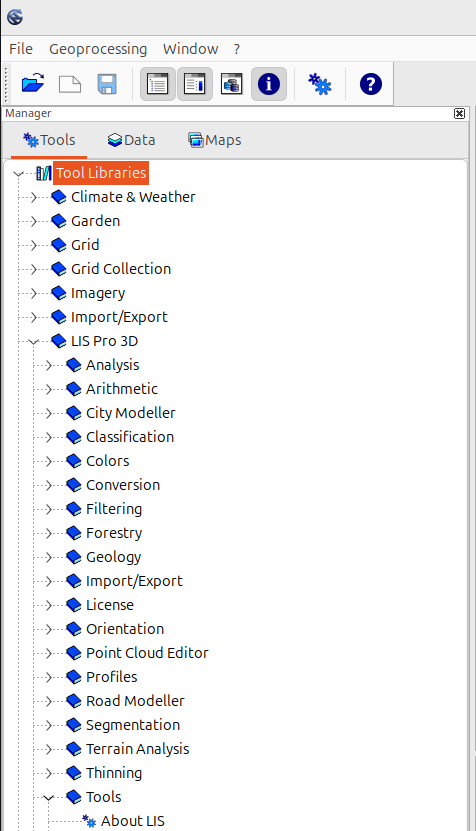
1. Via the “Tools” Tab in the “Manager” Window:
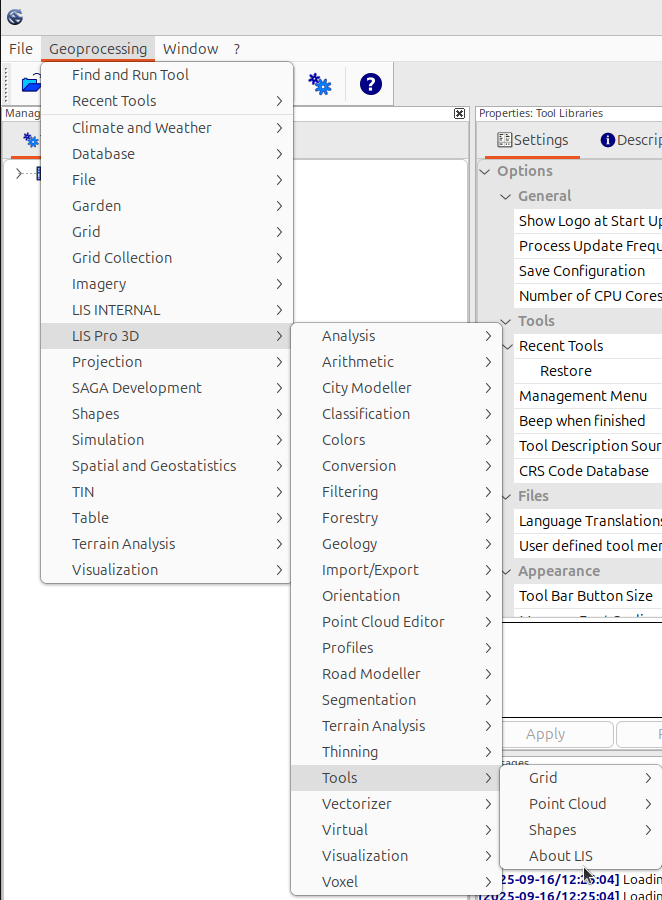
2. Via the “Geoprocessing” Menu:
3. Via the Search Function:
Open the search dialog via the “Geoprocessing” menu entry
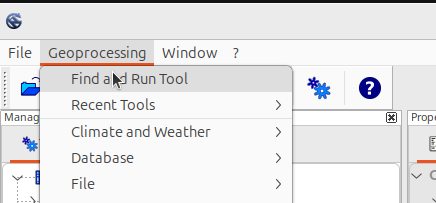
or with the “Run Tool” button in the toolbar:
Type the search text and click “Okay” to start the search:
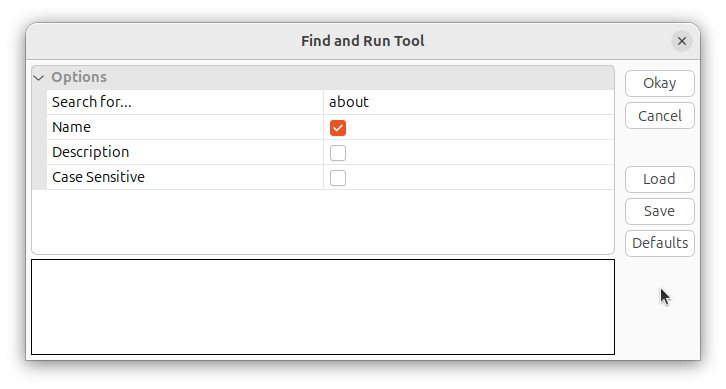
If the search text matched any tools, a new dialog will open up and allow you to select and run a tool.
How to Load Missing Tool Libraries and Where to Find Them
Every now and then, it can happen that some tools did not load correctly (both for SAGA GIS or LIS Pro 3D). However, this can easily be fixed.
Step 1 - Open File Dialog
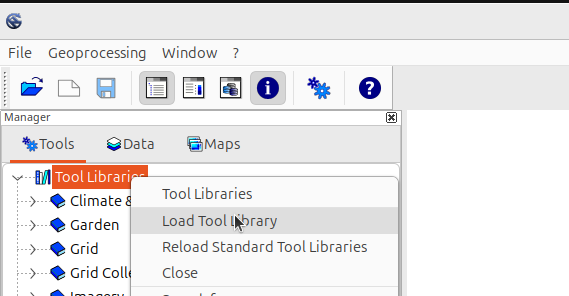
In the “Tools” tab of the “Manager” window, you can do a right click on “Tool Libraries” or any tool category to open up a context menu. The “Load Tool Library” entry, will open a file dialog (Figure 1).
Step 2 - Select Tools
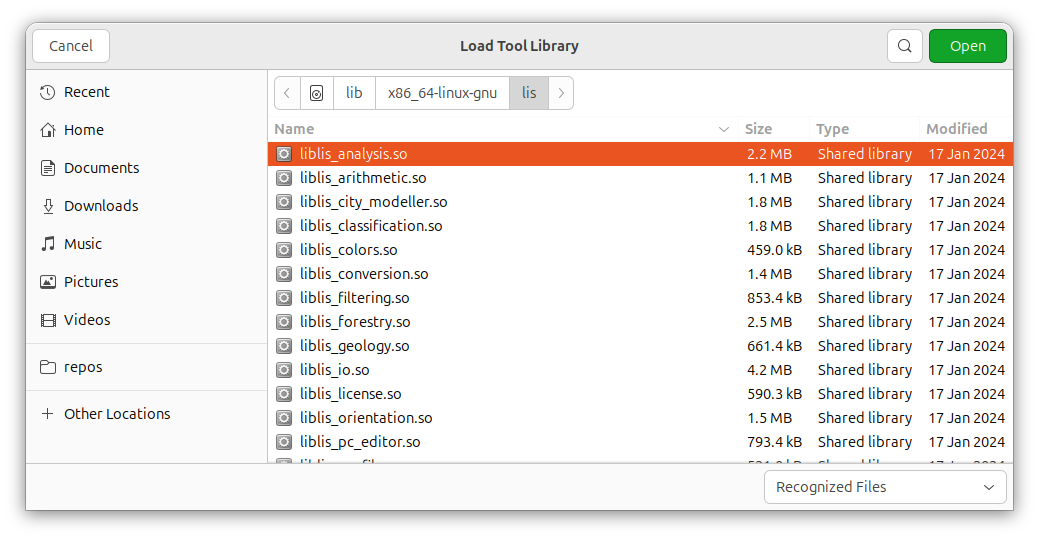
The file dialog allows you to navigate to the folder in which the tools (*.dll files on Windows or *.so files on Linux) are located.
Select one or several tools and click the “Open” button. SAGA will report whether the tool was loaded successfully in the “Messages” window.
If you are on Windows, you can find the *.dll files for the SAGA GIS tools and the LIS Pro 3D tools in your LIS Pro 3D installation folder in the tools and tools_lis folders, respectively. On Linux, the tools, in the form of *.so files, are located in the /lib/x86_64-linux-gnu/saga and /lib/x86_64-linux-gnu/lis folders, respectively.