Structural Geology - Data Download and Inspection
Overview
This tutorial presents a complete workflow for using the LIS Pro 3D Geology package to derive discontinuity sets, joint planes, and discontinuity spacings. For a quick overview of the topic, you can visit our related blog post.
Structural geology investigates the three-dimensional arrangement and deformation of rock masses. Accurate measurement of rock geometries is fundamental for understanding geological structures and assessing their engineering significance.
Rock slope stability is largely controlled by the distribution and characteristics of structural discontinuities, such as joints, bedding planes, and faults. These discontinuities represent surfaces of weakness that interrupt the continuity of the rock mass and can significantly reduce its overall strength.
The orientation of discontinuities relative to a slope or engineered excavation plays a critical role in determining whether unstable conditions may develop and which failure mechanisms are likely to occur. In addition, the spacing and orientation of discontinuity sets govern the size and shape of rock blocks, making their accurate characterization essential for geotechnical and engineering geological assessments.
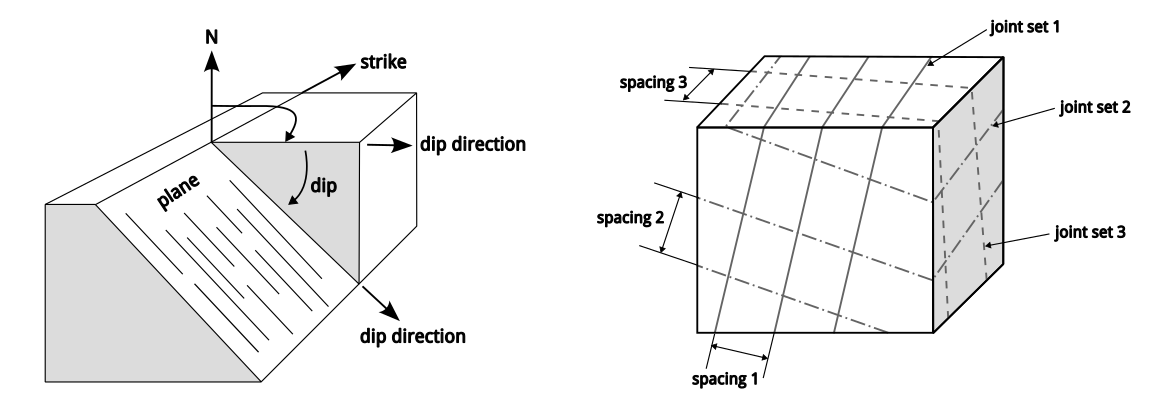
Illustration of dip direction and dip (left) and joint sets and their corresponding spacing (right).
Joint orientation and spacing are key parameters for rock mass characterization, engineering design, and natural hazard assessment. Advances in terrestrial laser scanning (TLS) and point cloud processing now make it possible to extract these parameters automatically using specialized analysis tools. Compared with traditional field mapping, this approach provides a substantially larger number of measurements, improves statistical reliability, and enables the investigation of inaccessible rock faces.
The following sections introduce the tools available in the LIS Pro 3D Geology package for the detection, characterization, and analysis of discontinuities directly from TLS point cloud data.
Data Download
To reliably determine the orientations of all discontinuities within a rock face, scanning must be performed from multiple positions and viewing directions to minimize occlusions and scan shadows. Before starting the actual analysis, several preparatory steps are required to preserve all information necessary for the workflow. For example, we require the “direction-to-scanner” vector for each point in order to orient surface normals correctly, since their orientation is mathematically ambiguous for vertical and overhanging sections of a rock slope.
After point cloud registration, which is usually performed within the scanner software, the point cloud from each scan position must be exported as a separate file. In addition, the scanner positions are required as point geometries. In some cases, these can also be exported directly from the scanner software; otherwise, they must be prepared manually.
You can download the datasets used in this tutorial here.
The dataset includes three LAZ files containing scans from three different scan positions, as well as a GeoPackage point layer containing the corresponding scanner positions.
Data Inspection
We use the Import LAS/LAZ Files tool to import all scan positions at once. In addition to the x, y, and z coordinates, we also import the intensity and RGB color attributes for visualization purposes.
Tool: Import LAS/LAZ Files
Geoprocessing → LIS Pro 3D → Import/Export → LAS/LAZ // Tools → LIS Pro 3D → Import/Export
| Parameter | Setting |
|---|---|
| Options | |
| Input Files | “scan_1.laz” “scan_2.laz” “scan_3.laz” |
| Attributes to import besides x,y,z … | |
| … | |
| Intensity | 🗹 |
| … | |
| RGB color | 🗹 |
| … | |
| Options | |
| Classes | |
| Last Returns | ☐ |
| R,G,B Value Range | 16 bit |
| Import AOI | ☐ |
| Point Cloud Thinning | ☐ |
You can load the scan_positions.gpkg file from the “File → Open” menu or simply drag and drop it into the GUI. Adding the data to the map displays the scanned rock slope together with the three scanner positions.
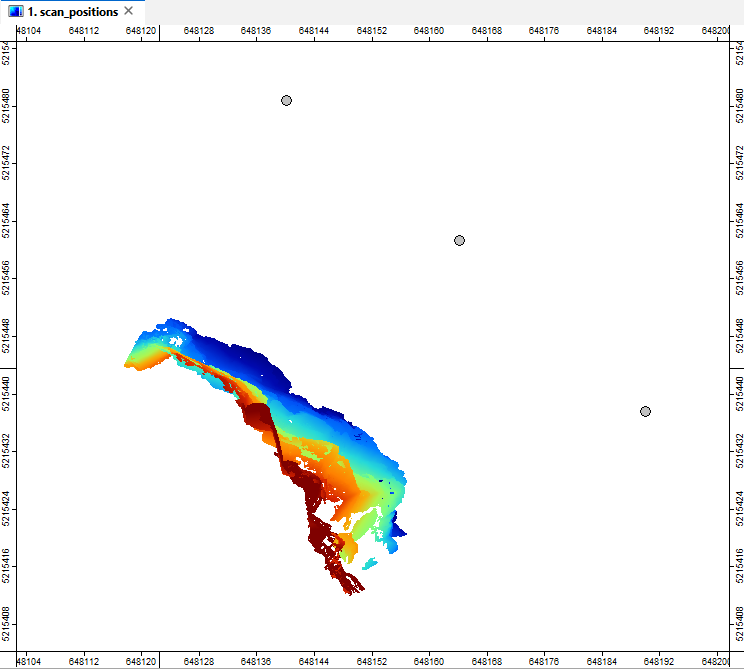
The point clouds and the three scanner positions displayed in the map view.